
May 09, 2024
Webinar Recap: Fuel Inventory Variance Control – Why Speed and Precision Matter

Read More

by Kurt Gutzmann, Chief Scientist
What exactly is a “tank chart” and why do we want it to be “perfect”? A tank chart tells us how much liquid is in a tank based on the height of the liquid. It sounds simple. Tanks might be cylindrical, or they might be ‘capsules’, cylinders with hemispherical end caps (see Figure 1). Still, there are some formulas from analytical geometry that will give us the volume of liquid for a given. The tank might be tilted a bit, perhaps 1 inch (25 mm) from one end to the other, so the liquid will pool at one end as it gets low.
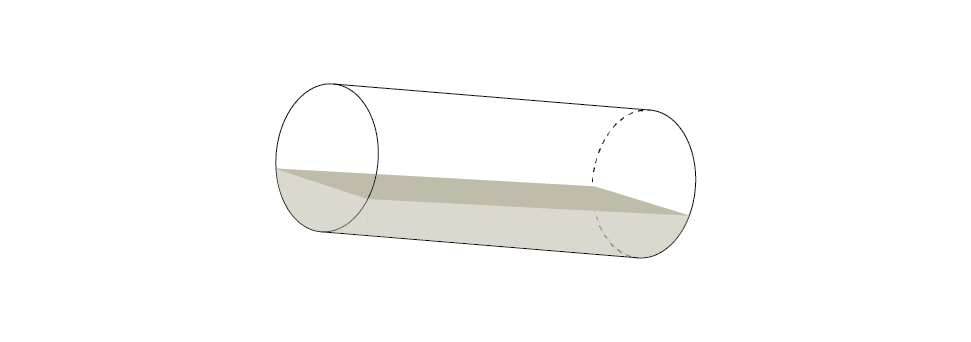
Figure 1. Ideal Tilted Cylinder
This problem was solved over 350 years ago when Euclidean geometry met Newton and Leibniz calculus. However, the “solution” makes the very big assumption that our tank is “perfect”, i.e. it is well and truly a cylinder. The reality is the tank only looks like a cylinder at a coarse level of resolution. If we zoom in on the tank, we will find all kinds of irregularities, deformations, and internal volume-occupying structures (gussets, pipes, pumps, welds, and more). These cause the tank’s shape to depart significantly from the ‘ideal cylinder’ or ‘ideal capsule’. So, the volume calculation above will produce errors by overstating the volume here and understating it elsewhere in an unknown manner.
Is the calculation good enough? That depends on what we are doing with the volume. For bookkeeping purposes, it might be sufficient. For measuring how much fuel we just received in a delivery, it might be close (+/- 3%) but probably not. For leak detection, it is not nearly good enough. For precision and accuracy of inventory variance for environmental compliance purposes (+/- 1% US, +/-0.5% Canada) the calculation will fail most of the time.
If we have a more perfect calculation, one that accurately and precisely (see Figure 2) gives us volume from height, we can use that ‘perfect tank chart’ with confidence that the numbers are correct.
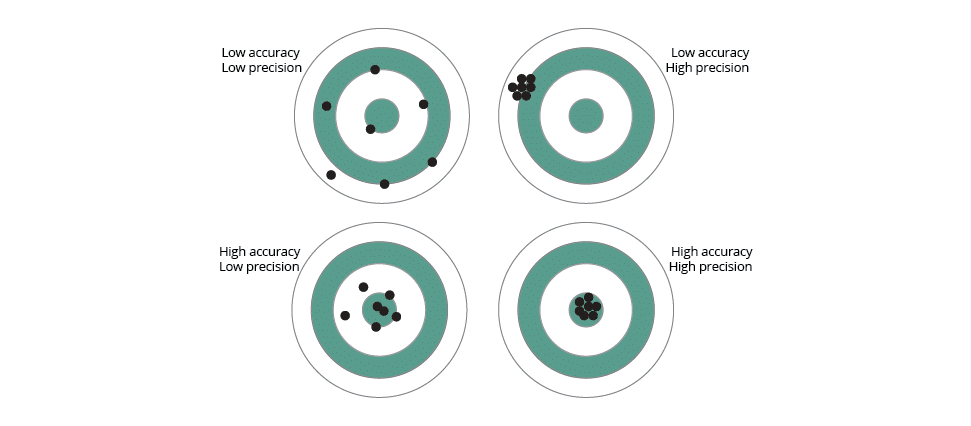
Figure 2. Precision and Accuracy
So how do we get such a perfect chart? One way might be to pour known amounts of liquid into the tank, check the height, and record it as we gradually fill the tank. This might get us some accuracy, but if we want precision, we will have to use little tiny amounts at a time which is not feasible. The tank manufacturer uses this procedure to ‘calibrate the chart’ for the tank (the ‘strapping chart’), but it is only at a very coarse level and lacks precision. Another way to perfect the tank chart might be to put a laser rangefinder inside the tank and measure it for various distances in every direction and then use that data to build up a finite element model. This process works best on a truly empty tank, which is rare, so while the method is precise, it could also be inaccurate.
A third way would be to measure the amounts of fluid going in and out of the tank over time and record the corresponding heights. The inventory going into the tank must equal the fuel exiting the tank, unless there is some evaporation, breathing loss, or temperature-based shrinkage or expansion. This is close to perfect since we can account for the latter factors and record precise height measurements. The height measurements do not have be accurate for most purposes except for run-out estimates.
We are mainly interested in the changes in volume for changes in height (the differential domain). It does not matter much whether our ruler is on the bottom of the tank or 10 feet below the tank (see Figure 3) in order find height differentials.
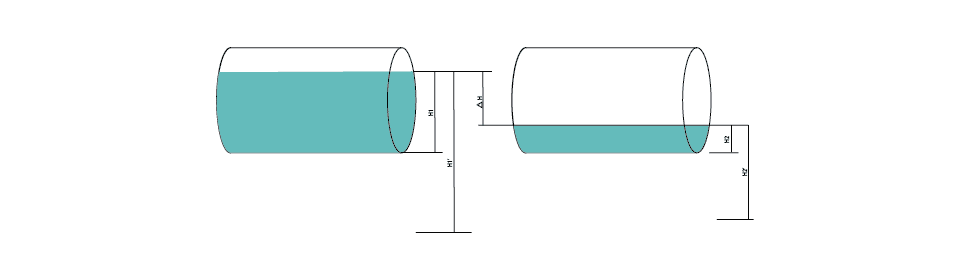
Figure 3. Height Difference Measurement
Titan has developed novel and innovative methods for analyzing the changes in height and volume that produce a tank chart that is much closer to perfection now than any prior methods in the industry. The Titan Cloud Perfect Chart is accurate and precise (the units of volume are micro-liters, and the height is measured in micrometers) which allows Titan to provide its customers with:
The Perfect Chart serves as the foundation for Fuel Analytics, Titan Cloud’s wetstock management solution that leverages your existing forecourt equipment for a greater return on your software investment. By starting with a precise and accurate tank chart, Fuel Analytics helps convenience store owners and operators minimize inventory variance and increase profits at every site monthly.
Contact one of our specialists, so you can start managing your wetstock with confidence.


