Optimize the Entire Fueling Experience with Frictionless Fuel Management
4 Keys to a High-Performing Environmental Team
10 Things Fleet Managers Need to Know
Read more from our thought leaders on Energy Asset Optimization, industry trends, and best practices.
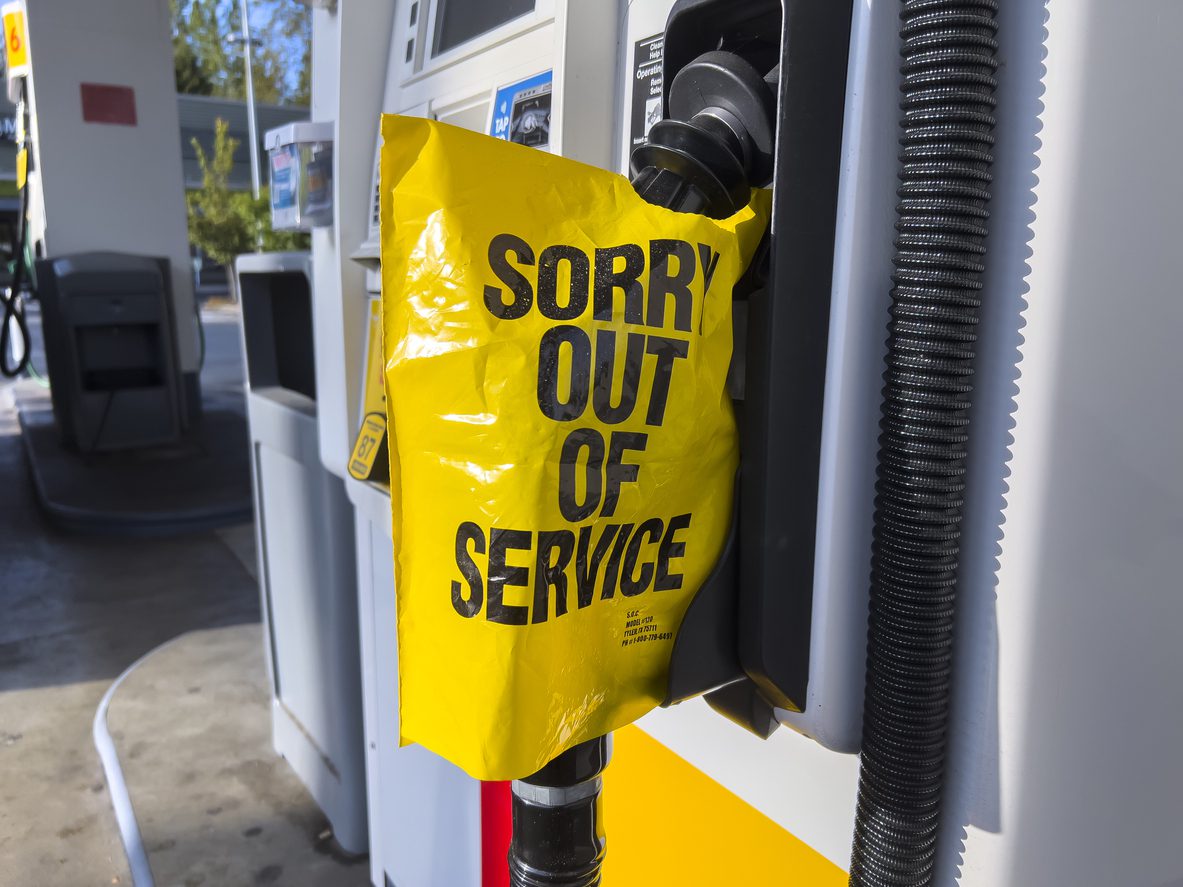
Nozzle Down? Revenue Down.
Nick Viola
Carrier-Managed Logistics Needs More Than Communication. It Needs Control.
Hannah Powers
Managed Services for Compliance
Suvro Khan
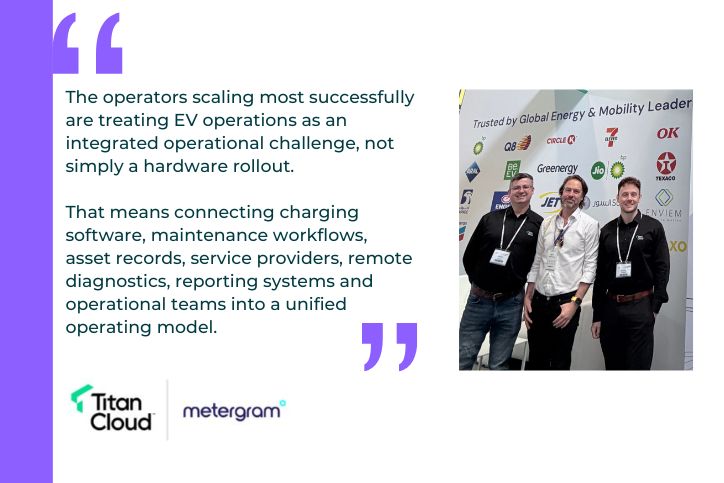
The Forecourt EV Gap: Why Having Chargers Isn’t the Same as Having an EV Strategy
Brad Sandys
How Fuel Retailers and Fleets Can Detect Fuel Theft Faster with Fuel Analytics
Brent Puzak
How to Detect and Reduce Fuel Loss with SIR and Leak Monitoring
Seb Kachoei
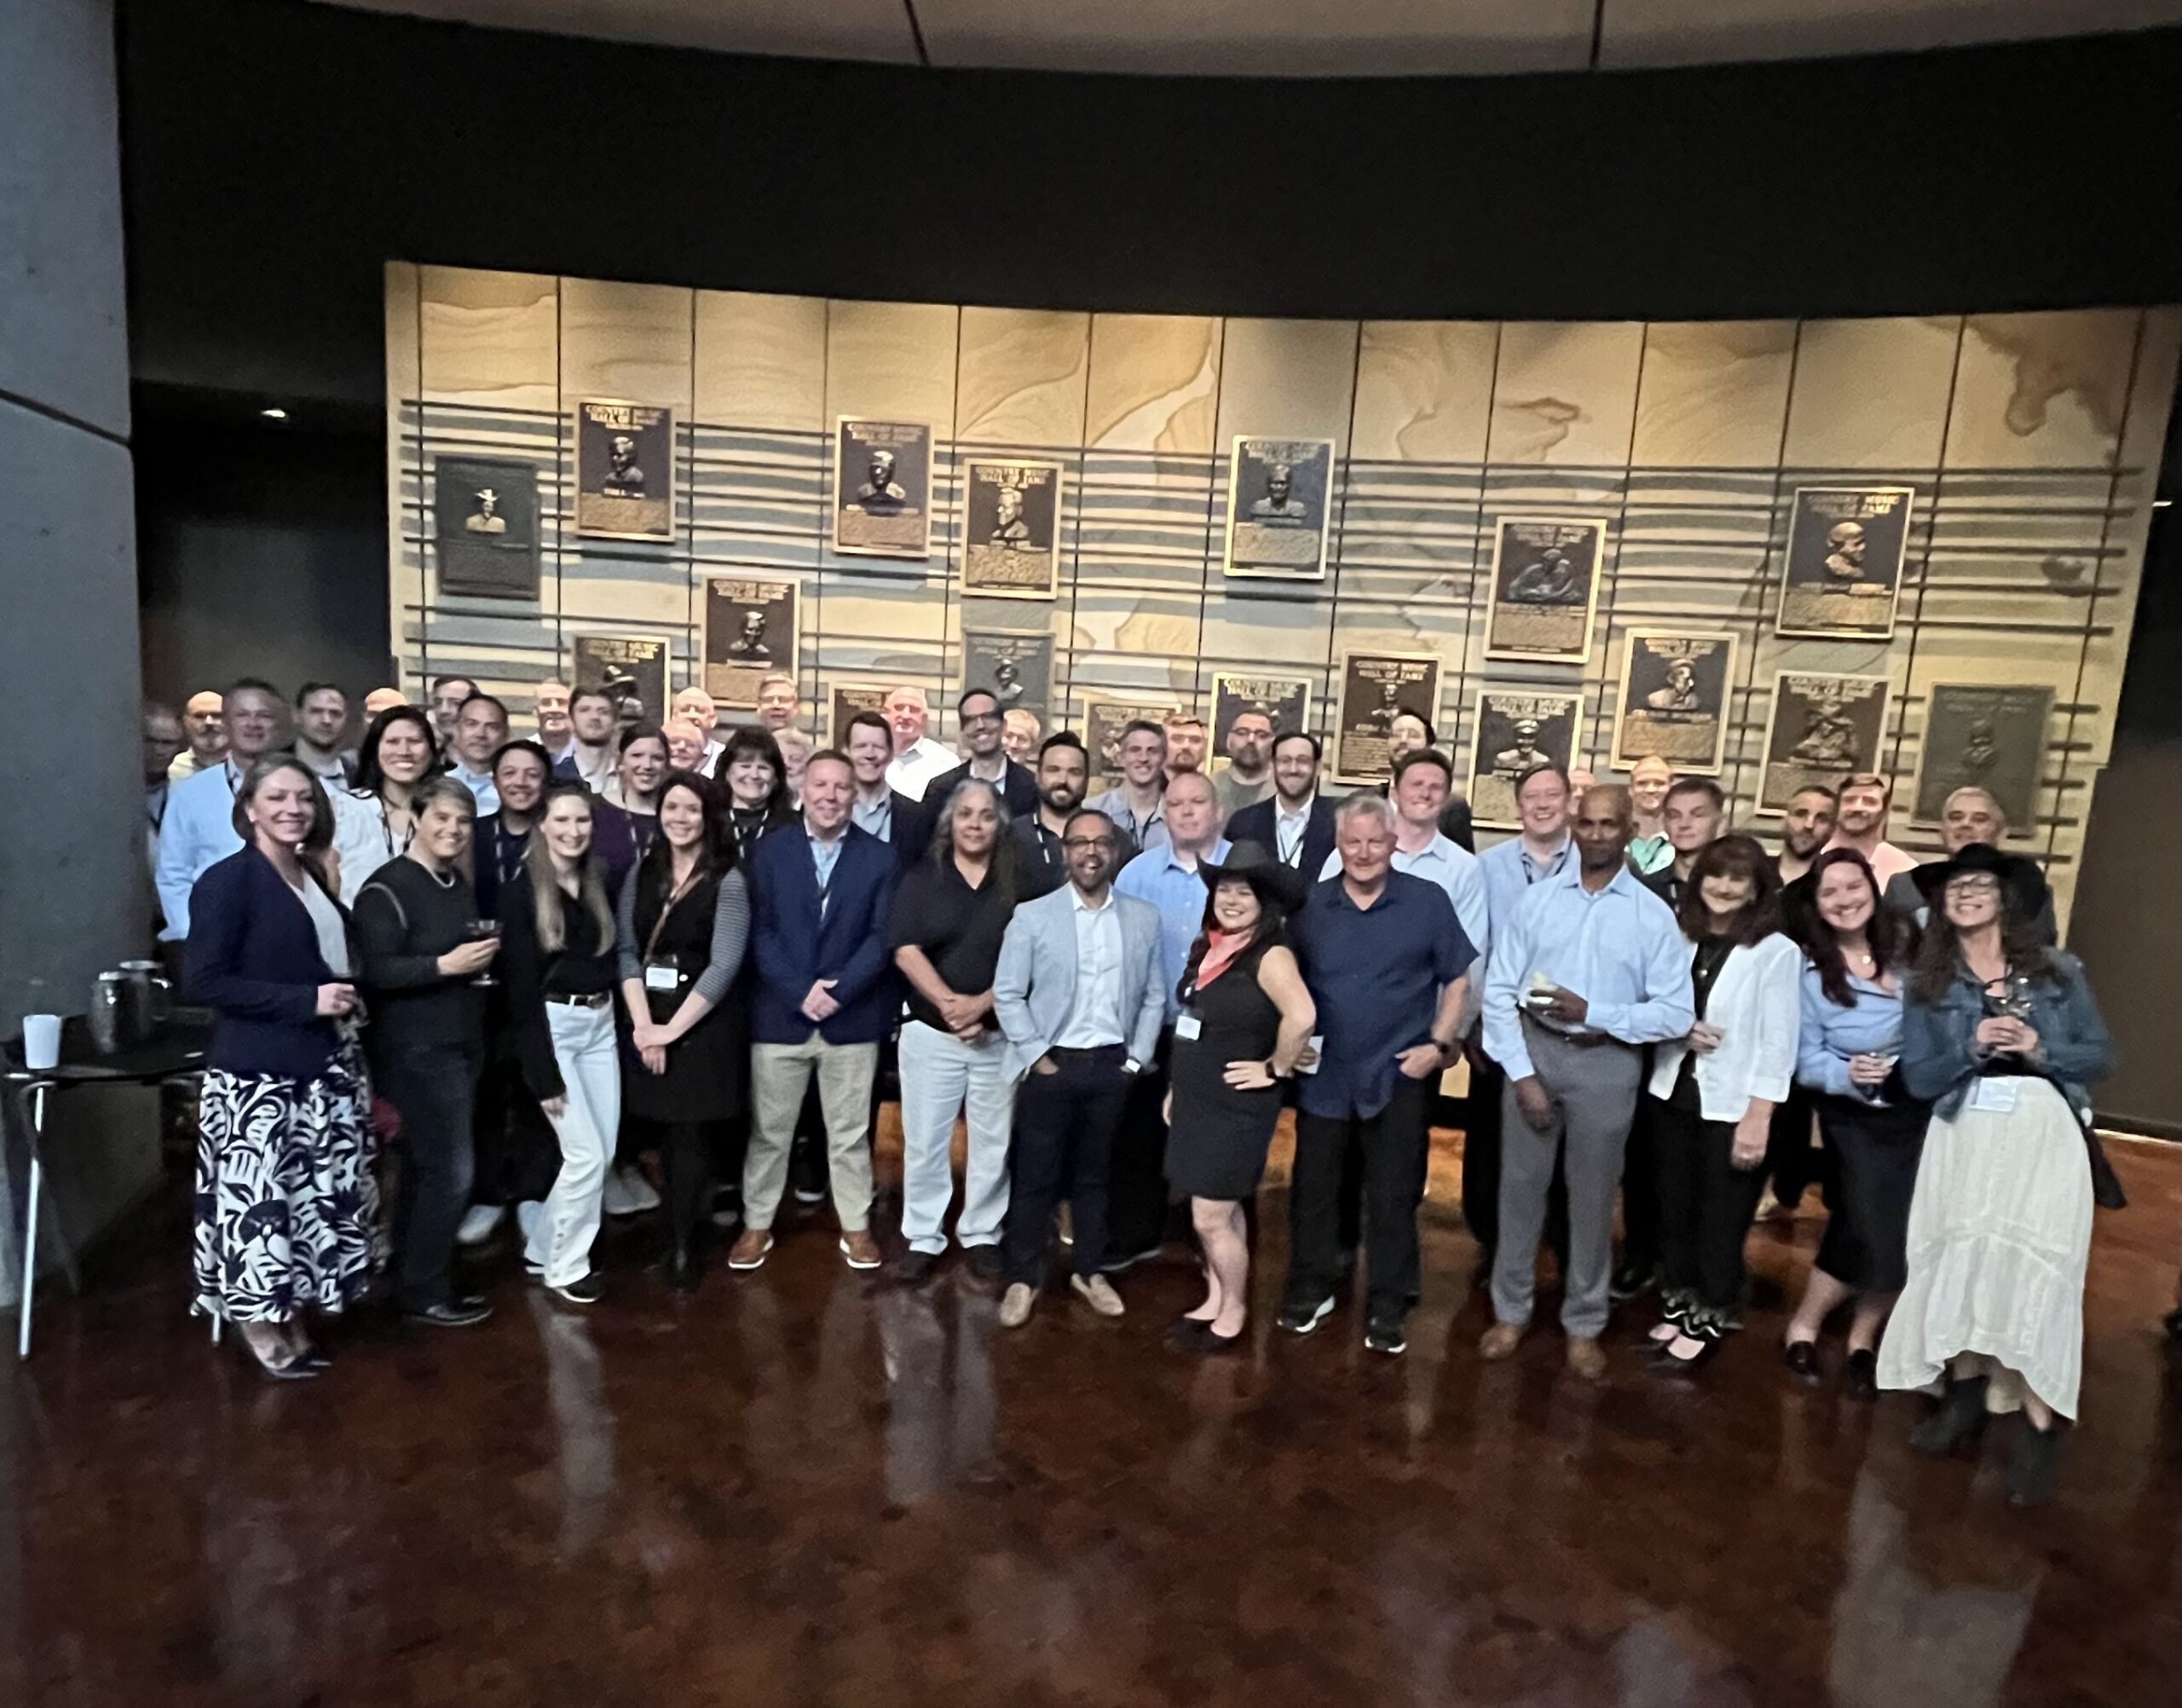
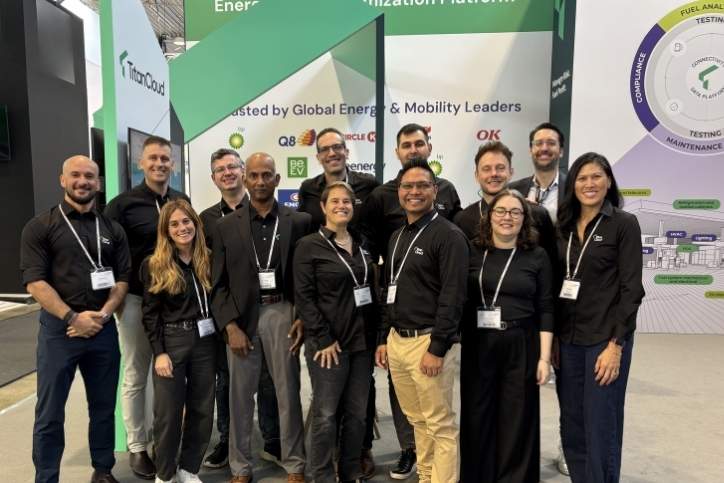
Titan Cloud 2026 Executive Circle: Customer Leaders Gather to Shape What’s Next in Fuel Operations
2026 UNITI Expo 2026 Recap: Why Mobility Operators Need a More Unified Way to Run Fuel, EV, Maintenance, and Compliance
Chris Cooper
Titan Cloud and Metergram Partner to Help CPOs Improve Charger Reliability and Integration Readiness
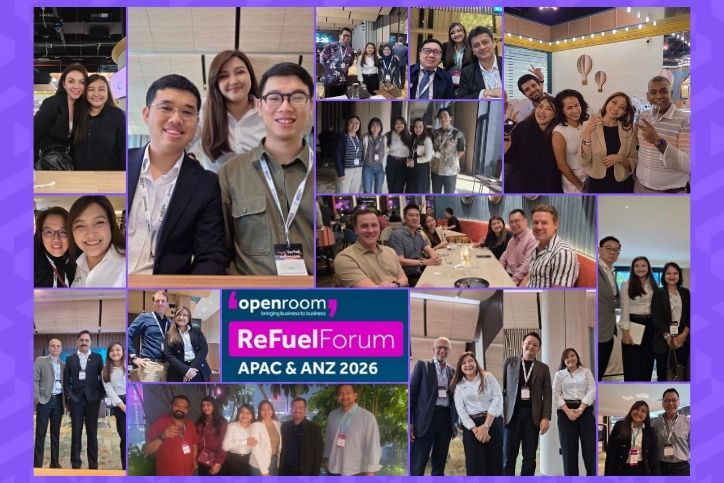
Work From Anywhere, Operate From Everywhere: How Titan Cloud Supports Remote Fuel Operations in APAC
Nurul Johari
4 Fuel Loss Scenarios — and How Leading Operators Are Stopping Them
Close the Loop on Risk: Automate the Path from Findings to Fixes with Titan Compliance + Maintenance
Luke Young
Subscribe today to stay informed and get regular updates from Titan Cloud


")