Mar 10, 2026
Fuel Variance in Focus: Benchmarking Wetstock Management Across Europe

Read More

Fuel loss across retail fuel networks rarely comes from a single dramatic event. More often, it accumulates quietly through a mix of theft, manipulation, delivery discrepancies, and mechanical drift. Each issue may appear small in isolation, but across distributed fuel operations those incremental losses can quickly compound into significant financial impact.
That challenge is being amplified as fuel theft becomes more sophisticated and organized. Recently, in the U.S., authorities uncovered schemes in Florida where criminals used magnets to manipulate fuel pumps and dispense diesel without payment, causing significant losses for retailers.
Incidents like these highlight how modern theft methods can bypass traditional controls and remain difficult to detect without continuous visibility into operations.
Through discussions with fuel retail operators and industry experts, clear patterns have emerged around where losses occur, how they are detected, and what changes when fuel variance is treated as a continuous operational priority rather than a periodic reconciliation exercise.
For one retailer, theft had become one of the largest contributors to overall fuel loss across many retail networks. After implementing targeted detection and mitigation strategies, operators were able to reduce losses significantly, bringing overall variance down to roughly 0.1% of total fuel volume.
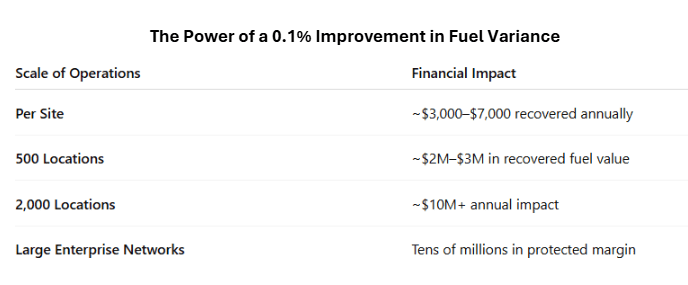
That percentage may sound small, but in fuel retail operations even fractions of a percent carry real financial weight.
A tenth of a percentage point improvement in fuel variance can translate into thousands of dollars in recovered value per location each year. Across large retail networks, those gains scale quickly, turning incremental improvements in detection and accountability into tens of millions of dollars in recovered fuel value annually. In an industry where fuel margins typically range between 3% and 5%, protecting even a small fraction of loss can have a meaningful impact on profitability.
What follows are four of the most common fuel loss scenarios observed in fuel retail operations, including how they occur, how they are detected, and what ultimately makes the difference in preventing them.
One of the simplest theft methods is also one of the most direct. A van parks over the underground tank delivery inlet. A hose with a pump is inserted into the fill point, and product is extracted from the tank. There is no transaction at the POS. No visible sign of tampering at the dispenser. The only signal that something is wrong is that tank inventory drops without corresponding sales.
Detection depends on reconciling tank levels against recorded transactions. When the decline exceeds expected thresholds, a sudden loss alarm is triggered. In several cases, CCTV footage captured at regular intervals showed the vehicle lowering slightly as fuel was removed. That visual record was later used as evidence in police investigations.
Pulser manipulation is more technical and often more organized.
In these cases, an individual posing as a service technician intercepts the pulser wiring inside the dispenser and installs a concealed Bluetooth-activated device that reduces pulse output. The pump then reports dispensing only a fraction of the actual volume delivered. For example, 100 liters may be dispensed while only 60 liters are recorded and charged, with payment frequently made using gift cards to reduce traceability.
Initially, these incidents were identified during next-day reconciliation, when inventory losses did not align with recorded sales. The delay made it difficult to intervene in real time.
To address this, certain regions implemented on-site analytics designed to flag unrealistic flow rates during extended transactions, patterns that fall outside normal operating parameters. Alerts are now escalated within minutes rather than hours, significantly improving response time.
In several states during 2023, more than 2,000 pulser manipulation incidents were occurring annually. After rapid detection and escalation measures were introduced, the issue was effectively eliminated in those regions or displaced to networks without similar controls.
Loss does not always occur at the pump. In short-delivery schemes, fuel trucks stop roadside before reaching the station and offload 100 to 500 liters into another vehicle. By the time the shipment arrives and is unloaded, the measured volume no longer matches the Bill of Lading.
Detection depends on comparing temperature-corrected delivered volume against expected quantities, with variance thresholds flagging discrepancies for investigation. As larger thefts were identified and addressed, behavior began to shift. Instead of removing hundreds of liters at a time, perpetrators reduced the quantities taken in order to remain below established alarm thresholds.
In higher-risk regions, operators introduced truck-mounted sensors to log stop locations and inlet activations, adding another layer of oversight. In some instances, those sensors were deliberately disabled, which required more frequent physical inspections and tighter procedural controls. As oversight increased, the methods used to bypass it evolved as well, reinforcing that fuel variance management is an ongoing operational discipline rather than a one-time fix.
Not every loss scenario involves criminal intent. Meter drift is a natural mechanical phenomenon in which dispensers gradually begin to over-dispense relative to the volume recorded by the system, meaning customers receive slightly more fuel than is measured. The impact develops slowly and can be difficult to detect without long-term trend analysis. Unlike theft, which typically creates sudden and noticeable discrepancies, meter drift shows up as consistent, product-specific variance over time.
In a large national retail network, meter drift currently accounts for approximately USD 10 million in annual losses. Measurement standards organizations have long documented that even minor calibration deviations, when multiplied across thousands of high-throughput dispensers, can create significant financial exposure. Addressing it requires a focused approach: identifying dispenser-level trend anomalies, verifying meter accuracy onsite, and recalibrating where necessary to restore precision.
The difference between average performance and consistent margin protection comes down to visibility, specifically into:
When these controls run continuously instead of periodically, issues surface sooner and teams can respond while they are still small. Over time, that changes outcomes. Losses are reduced, investigations are faster, and patterns that once went unnoticed become part of routine operational oversight.
Titan Cloud’s Fuel Analytics is designed to make fuel variance visible before it becomes a write-off. By continuously monitoring tank levels, deliveries, POS transactions, dispenser data, and flow rates, operators can quickly spot sudden losses, delivery discrepancies, abnormal dispensing behavior, and long-term meter drift.
That visibility changes the conversation internally. Instead of reviewing unexplained shrink at month-end, teams can investigate issues while they’re happening, whether it’s a delivery variance, a calibration issue, or something more deliberate.
For many networks, the biggest financial gains haven’t come from increasing volume. They’ve come from tightening control over the fuel already moving through their system.
If you’d like to see how your network is performing — or where hidden variance may be sitting today — connect with a Titan Cloud solutions consultant. You can also learn more about how Flow Rate Monitoring and Fuel Analytics work together to detect abnormal dispensing behavior in near real time.